

Bubbles180
-
Posts
539 -
Joined
-
Last visited
-
Days Won
8
Posts posted by Bubbles180
-
-
Tomorrow's Tracks Stats
48 Lingfield Park Racecourse 601 169 432 28.12% 12,020.00 109.34 0.91% 0.18
57 Worcester Racecourse 194 53 141 27.32% 3,880.00 -81.60 -2.10% -0.42
58 Huntingdon Racecourse 115 37 78 32.17% 2,300.00 -115.40 -5.02% -1.004
-
7 hours ago, Bubbles180 said:
Todays Tracks
Rank Racecourse Bets Wins Loss S/R Staked P&L ROI 5 Kempton Park 651 185 466 28.42% 13,020.00 1,344.74 10.33% 11 Carlisle Racecourse 207 66 141 31.88% 4,140.00 888.36 21.46% 25 Southwell Racecourse 354 110 244 31.07% 7,080.00 555.14 7.84% 9 winners from the 20 runners at the 3 tracks today
7/2, 2/5, 12/1, Evs, 2/9, 1/3, 2/1, 4/6, 20/1
Profit of +21.12
-
All todays tracks were in profit so backed all selections so good day all round espedially with 20/1 & 12/1 winners in the mix
- BillyHills and gbettle
-
 2
2
-
-
4 hours ago, tomyb said:
Fantastic stats Bubbles .....Do you know how the stats look if applying your 4-1 - 25-1 price strategy to just the courses with a winning record ,cutting out the losing ones ?
if ypu add the filters to the tracks that show a profit this will tell you mate
example
course CHELMSFORD
Result WIN & LOSS
Odds clear all Odds under 4/1 and over 25/1
If you want to add type you can but not needed
-
I have also done each of the UK tracks on the results page filtered by AW, FLAT & NH so you can tell whch type was run on particular days, and you can also filter between the 3 types.
-
just added the results page as well, both sheets now have filter buttons so you can filter any of the columns singularly or multiple, I have also added a button PPB which is PROFIT PER BET it shows how much profit is made for each bet made.
any questions please ask
-
Hi Guys the stats sheet is now on open share so anyone can use it please do not alter the original, make a copy if you wish to thats not a problem, also i have put filters into the headers so you can filter the columns in any way you wish so you can play around and find stats by different rankings hope this helps
-
-
hi their guys i am starting a post based on Billy's Track Stats for NH top 10 tracks, I have done a spreadsheet for all tracks to end of OCT 2017
For any who wishes to look you can find the spread sheet here on google sheets
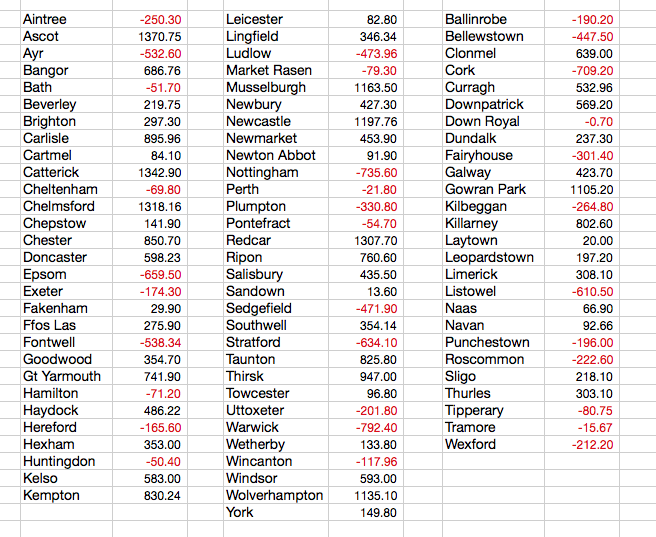
Rank Racecourse Bets Wins Loss S/R Staked P&L ROI 1 Chelmsford City Racecourse 484 150 334 30.99% 9,680.00 1,750.46 18.08% 2 Ascot Racecourse 193 66 127 34.20% 3,860.00 1,545.55 40.04% 3 Newcastle Racecourse 571 159 412 27.85% 11,420.00 1,391.76 12.19% 4 Chester Racecourse 124 46 78 37.10% 2,480.00 1,391.10 56.09% 5 Kempton Park 651 185 466 28.42% 13,020.00 1,344.74 10.33% 6 Catterick Racecourse 224 77 147 34.38% 4,480.00 1,251.30 27.93% 7 Redcar Racecourse 181 56 125 30.94% 3,620.00 1,217.50 33.63% 8 Musselburgh Racecourse 232 73 159 31.47% 4,640.00 1,143.40 24.64% 9 Thirsk Racecourse 157 52 105 33.12% 3,140.00 1,076.50 34.28% 10 Gowran Park races (mixed) 146 49 97 33.56% 2,920.00 1,039.80 35.61% 11 Carlisle Racecourse 207 66 141 31.88% 4,140.00 888.36 21.46% 12 Newmarket Racecourse 351 107 244 30.48% 7,020.00 866.60 12.34% 13 Taunton Racecourse 87 35 52 40.23% 1,740.00 825.80 47.46% 14 Killarney races (mixed) 106 36 70 33.96% 2,120.00 802.60 37.86% 15 Wolverhampton Racecourse 649 170 479 26.19% 12,980.00 745.43 5.74% 16 Windsor Racecourse 229 69 160 30.13% 4,580.00 679.90 14.84% 17 Ffos Las Racecourse 164 46 118 28.05% 3,280.00 675.10 20.58% 18 Bangor on Dee Racecourse 116 41 75 35.34% 2,320.00 665.65 28.69% 19 Salisbury Racecourse 162 47 115 29.01% 3,240.00 651.95 20.12% 20 Curragh 190 61 129 32.11% 3,800.00 635.71 16.73% 21 Goodwood Racecourse 157 49 108 31.21% 3,140.00 619.70 19.74% 22 Yarmouth Racecourse 222 69 153 31.08% 4,440.00 614.80 13.85% 23 Ripon Racecourse 143 44 99 30.77% 2,860.00 605.83 21.18% 24 Hexham Racecourse 119 41 78 34.45% 2,380.00 576.50 24.22% 25 Southwell Racecourse 354 110 244 31.07% 7,080.00 555.14 7.84% 26 Kelso Racecourse 110 33 77 30.00% 2,200.00 552.20 25.10% 27 Limerick races (mixed) 193 48 145 24.87% 3,860.00 549.10 14.23% 28 Clonmel races (mixed) 88 33 55 37.50% 1,760.00 539.00 30.63% 29 Downpatrick 93 27 66 29.03% 1,860.00 538.60 28.96% 30 Doncaster Racecourse 295 82 213 27.80% 5,900.00 473.63 8.03% 31 Tramore races (mixed) 102 27 75 26.47% 2,040.00 426.20 20.89% 32 Dundalk races (all-weather) (flat) 342 92 250 26.90% 6,840.00 421.40 6.16% 33 Haydock Park Racecourse 244 71 173 29.10% 4,880.00 417.22 8.55% 34 Beverley Racecourse 181 48 133 26.52% 3,620.00 393.75 10.88% 35 Thurles races (mixed) 83 28 55 33.73% 1,660.00 373.10 22.48% 36 Leicester Racecourse 240 76 164 31.67% 4,800.00 305.80 6.37% 37 Newbury Racecourse 230 69 161 30.00% 4,600.00 301.70 6.56% 38 Leopardstown races (mixed) 193 48 145 24.87% 3,860.00 229.70 5.95% 39 Perth Racecourse 131 37 94 28.24% 2,620.00 214.50 8.19% 40 Sligo races (mixed) 52 19 33 36.54% 1,040.00 202.10 19.43% 41 Brighton Racecourse 210 54 156 25.71% 4,200.00 172.30 4.10% 42 Cheltenham Racecourse 95 26 69 27.37% 1,900.00 171.10 9.01% 43 Newton Abbot Racecourse 150 47 103 31.33% 3,000.00 170.73 5.69% 44 Fakenham Racecourse 65 17 48 26.15% 1,300.00 159.90 12.30% 45 York Racecourse 158 36 122 22.78% 3,160.00 138.80 4.39% 46 Wincanton Racecourse 97 31 66 31.96% 1,940.00 122.04 6.29% 47 Laytown races (flat) 12 3 9 25.00% 240.00 112.00 46.67% 48 Lingfield Park Racecourse 600 168 432 28.00% 12,000.00 109.34 0.91% 49 Towcester Racecourse 75 20 55 26.67% 1,500.00 101.80 6.79% 50 Cartmel Racecourse 71 19 52 26.76% 1,420.00 84.10 5.92% 51 Wetherby Racecourse 137 42 95 30.66% 2,740.00 83.80 3.06% 52 Galway races (mixed) 119 40 79 33.61% 2,380.00 76.70 3.22% 53 Market Rasen Racecourse 162 50 112 30.86% 3,240.00 50.10 1.55% 54 Kilbeggan races (jumps only) 73 19 54 26.03% 1,460.00 45.20 3.10% 55 Hamilton Park Racecourse 149 37 112 24.83% 2,980.00 1.00 0.03% 56 Sandown Park Racecourse 189 47 142 24.87% 3,780.00 -54.40 -1.44% 57 Worcester Racecourse 193 52 141 26.94% 3,860.00 -81.60 -2.11% 58 Huntingdon Racecourse 114 36 78 31.58% 2,280.00 -115.40 -5.06% 59 Chepstow Racecourse 267 77 190 28.84% 5,340.00 -115.60 -2.16% 60 Cork races (mixed) 88 38 50 43.18% 1,760.00 -116.60 -6.63% 61 Naas races (mixed) 144 45 99 31.25% 2,880.00 -128.20 -4.45% 62 Navan races (mixed) 150 39 111 26.00% 3,000.00 -133.76 -4.46% 63 Bath Racecourse 189 52 137 27.51% 3,780.00 -136.70 -3.62% 64 Fairyhouse races (mixed) 157 42 115 26.75% 3,140.00 -151.40 -4.82% 65 Hereford Racecourse 63 15 48 23.81% 1,260.00 -165.60 -13.14% 66 Exeter Racecourse 109 33 76 30.28% 2,180.00 -176.30 -8.09% 67 Down Royal 90 22 68 24.44% 1,800.00 -210.70 -11.71% 68 Uttoxeter Racecourse 174 46 128 26.44% 3,480.00 -217.80 -6.26% 69 Plumpton Racecourse 109 30 79 27.52% 2,180.00 -220.80 -10.13% 70 Aintree Racecourse 58 13 45 22.41% 1,160.00 -260.30 -22.44% 71 Ludlow Racecourse 116 31 85 26.72% 2,320.00 -263.96 -11.38% 72 Ballinrobe races (mixed) 81 18 63 22.22% 1,620.00 -281.70 -17.39% 73 Tipperary races (mixed) 118 35 83 29.66% 2,360.00 -284.55 -12.06% 74 Roscommon races (mixed) 83 21 62 25.30% 1,660.00 -321.00 -19.34% 75 Punchestown races (mixed) 130 31 99 23.85% 2,600.00 -326.40 -12.55% 76 Pontefract Racecourse 143 34 109 23.78% 2,860.00 -327.63 -11.46% 77 Wexford races (National Hunt only) 92 25 67 27.17% 1,840.00 -370.50 -20.14% 78 Fontwell Park Racecourse 169 46 123 27.22% 3,380.00 -440.14 -13.02% 79 Bellewstown races (mixed) 52 11 41 21.15% 1,040.00 -447.50 -43.03% 80 Listowel races (mixed) 114 26 88 22.81% 2,280.00 -497.50 -21.82% 81 Ayr Racecourse 263 63 200 23.95% 5,260.00 -513.20 -9.76% 82 Nottingham Racecourse 191 38 153 19.90% 3,820.00 -597.40 -15.64% 83 Sedgefield Racecourse 146 35 111 23.97% 2,920.00 -611.90 -20.96% 84 Warwick Racecourse 127 34 93 26.77% 2,540.00 -639.00 -25.16% 85 Epsom Downs Racecourse 92 14 78 15.22% 1,840.00 -687.10 -37.34% 86 Stratford-on-Avon Racecourse 156 36 120 23.08% 3,120.00 -823.10 -26.38% - Sir Puntalot, minhtri32132, Saint R and 3 others
-
2
-
 4
4
-
On 10/11/2017 at 5:56 PM, BillyHills said:
Worcester is -81.60
from Aug 2016 - end of Oct 2017
204 races

I make it
-81.60 Flat Profit 141 Losers 52 Winners 193 Runners 26.94% Strike Rate -
Hi guys just a question would it be possible to put on the results page the selections made by you from the tips page so if looking back over the results we can see what was selected for that race if it was in the frame, thanks
-
-
On 01/10/2017 at 12:39 PM, BillyHills said:
I have some stats on all the courses for a full year, Aug 2016 - Aug 2017
Interesting reading:
All of the AW tracks are showing a decent profit, the out and out AW courses that include, Dundalk, Chelmsford and Wolverhampton are doing well>
Kempton, Southwell, Lingfield and Newcastle obviously include NH races as well as the AW.
I have absolutely no idea why some tracks should be better than others, why Redcar is +1,300 and Notts is -700 is a mystery to me.
Have you an update on these please Billy (to date) as very interesting can work some other systems from this not added Worcester or Tralle any reason,
-
-
Going Nicely Billy
Had Teddy Tee E/W
Done the others but got bigger prices
2.40: Princess Mononoke 4/1 bet365
3.10: Rivabodiva 7/1
3.40: More Madness 12/1 -
11 hours ago, nenad986 said:
Ty. Then is not good idea to go for daily target. With 3 per month maybe but this cant generate profit then. Only if you can take a look once more and tell me is ever happen to not get winner in 2 day? If it is not hapeen thet we can go in 5 step martengale on it. BUt will be very hard with high start bet.
No their has not been 2 consecutive days of losers, thr longest losing run is 5 not 6 like i said b4, the worst is a winner on first bet then 5 consecutive losses
-
-
OK days with no winners per month
Aug 5 days loss
Sep 3 days loss
Oct 5 days loss
-
-
-
-
Hi guys want to ask opinions on some betting advice if you are running a system and are showing a profit in different areas should you keep the whole system or alter the system.
Examples
system 1 Whole system
Total No. Bets 260
Total No. Wins 95
Total No. Lost 165
Strike Rate 36.54%
Stake 260.00
Win P&L 75.93
PoT 29.20%
ROI 151.86%System 2 (adapting system on odds basis)
Total No. Bets 113
Total No. Wins 35
Total No. Lost 78
Strike Rate 30.97%
Stake 113.00
Win P&L 66.16
PoT 58.55%
ROI 132.32%As you can see by altering some parameters the No of selections decreases but so does the S/R (only by a samll %),
The Stake decreases as does the ROI (again by a small %)
But The PoT increases significantly (Profit over Turnover)
Based on this in your opinion should the system be altered or not.
TIA for any help
-
TRACK STATS
in At The Races - Racing Forum
Posted
Stats for Lingfield NH Meetings
740.00 Total Staked
96.90 Flat Profit
13.09% ROI
37 Losers
14 Winners
51 Runners
27.45% Strike Rate